Abstract: To demonstrate the abiliTIes of the MAXQ microcontroller, we took benchmark code written for a compeTItor's microcontroller and ran it on the MAXQ2000. The results show that the MAXQ is one of the best 16-bit microcontroller cores available.
IntroducTIonThe MAXQ's unique transfer-triggered architecture makes it a top performer in the 16-bit microcontroller market. The MAXQ instrucTIon set features single-clock and instruction-cycle operations for jumps, calls, returns, loop control, and arithmetic operations. As a result the MAXQ enables applications to process more data in less time than other microcontrollers. Designers can thus add more functionality in their applications or reduce power consumption by completing required tasks quickly and spending more time in low-power stop modes.
To demonstrate the MAXQ's capabilities for this competitive analysis, we took benchmark code written to showcase the MSP430, ran it on the MAXQ, and monitored MAXQ performance. The competitor's code initially made the MAXQ function comparatively slow and inefficiently. Later when Rowley's highly optimized CrossWorks compiler for the MAXQ was released to the market, we reran the benchmark code. We found that Rowley's compiler used MAXQ architectural features more effectively, and that the MAXQ outperformed both the Texas Instruments (TI) MSP430 and the Atmel AVR. The MAXQ executed the same code in fewer clock cycles. In addition, this accelerated performance did not penalize the user with extra code size—the MAXQ's code size is within 2% of the competitors' code sizes.
This application note presents the details of our study of the MAXQ, Atmel AVR, and TI MSP430 architectures. This study is transparent—there are no tricks of compiler optimizations or specialized code made to force one microcontroller to perform better than another. Project files and source code are provided on the Maxim Web site so that the results can be duplicated. The results of this study (and other MAXQ performance studies) can be found at MAXQBenchmark.
Notes About MethodologyOf the two compilers in this study, the IAR Embedded Workbench and the Rowley CrossWorks, we used Rowley's compiler to generate the MAXQ's benchmark data because it made the best use of MAXQ capabilities. Both the IAR and Rowley compiler results were used for the MSP430 and the AVR microcontroller tests.
The data for execution time were gathered with the simulators that ship with IAR's Embedded Workbench and Rowley's CrossWorks toolsets. The execution cycles counted did not include startup time; the count started at the entry point into the main () function and ended with the main ( ) function's return statement.
Code sizes are in bytes and include both CONSTANT and CODE segments. This is because some tools include application constants in the CODE segment, which would make a device's code density appear incorrectly high. Combining the sizes of the CODE and CONSTANT segments ensure an equivalent comparison .
In general, we configured the compilers to use their highest code-optimization levels for ALL devices. This typically meant that all optimizations were enabled when targeting the smallest code size, and almost all optimizations were enabled when targeting the fastest code (because some compiler optimizations sacrifice speed for code size). In some instances, the high optimization settings caused problems—the code generated failed to simulate properly, never reaching the return statement. Often, the code began to work when the optimization level changed. We will indicate when such reductions of the optimization level were required. The project files that accompany this application note contain the optimization settings used to generate the benchmark data.
TI BenchmarkThis benchmark is a suite of tests published by Texas Instruments to showcase the MSP430. The suite contains 10 individual benchmarks: 8-bit math routines 8-bit matrix (array) accesses 8-bit switch statements 16-bit math routines 16-bit matrix (array) accesses 16-bit switch statement 32-bit math routines Floating point math routines Finite impulse response algorithm Matrix multiplication Following the TI test parameters, the MAXQ performed poorly. It generated code that was larger and slower than most of the other microcontrollers . Naturally, the TI study showed the MSP430 the winner in the comparisons. However, there were flaws in TI's methodology that demanded further analysis. Consequently, we examined how the MAXQ performed with the Rowley CrossWorks compiler.
The TI application note, including the source code, is available for download.
TI ResultsThe TI study provided results for execution speed (in clock cycles) and code density (in bytes), as shown in Table 1 and Table 2. Note that some of the device names (taken directly from the TI application note) are unclear. For instance, does 8051 refer to a 12-clock, 6-clock, 4-clock, or even 1-clock 8051 architecture?
Table 1. TI Study Results: Execution Speed ​​(no. Of cycles)
Table 2. TI Study Results: Code Size (no. Of bytes)
From this data, the MSP430 produced the densest code—45% smaller than the Atmel AVR microcontroller. The MSP430 also appeared to perform best, with the exception of the 32-bit ARM processor. These results also showed the MAXQ to be comparatively slow and inefficient.
Flaws with the TI Benchmark StudyThe manner in which TI produced its benchmarks raised some questions.
The first problem is that TI did not use any optimizations in their study. TI argued against compiler optimizations in order to remove the compiler from consideration and to make the microcontroller perform on its own. The problem with this argument is that engineers still use a compiler to generate machine code. If a compiler does not take advantage of the architectural features of a microcontroller when optimizations are not enabled, then you do not get a realistic idea of ​​the microcontroller's performance. In addition, benchmarks are only valuable if they model real applications . An engineer is likely to enable optimizations for size or speed in a real application, and these should thus be included as part of the benchmark study.
The second flaw in the TI benchmark study is that they only considered one compiler. Admittedly, the Rowley compiler was not available to TI at that time. Now available, the Rowley compiler dramatically updates the earlier TI results.
Maxim's ApproachAs explained above, our reevaluation of the TI benchmark focused on the MSP430, Atmel AVR, and MAXQ architectures. We considered execution and code size data for both the IAR Embedded Workbench and the Rowley CrossWorks toolsets. All results for execution speed were obtained through simulation.
The MAXQ device in this study was the MAXQ2000 microcontroller. In addition to an array of peripherals including an LCD controller, the MAXQ2000 has 16 16-bit accumulators and a 16 x 16 hardware multiply accelerator. For this study, we enabled the hardware multipliers on all three devices under test—we assumed that if performance on mathematical computations (such as a FIR filter) was important, a designer would choose a microcontroller with a multiply accelerator.
For the MSP430 device, we targeted the MSP430F149, a different device than TI targeted in their study (the MSP430F135). We chose the F149 because it has a hardware multiply unit, making comparison to the MAXQ2000 more equitable.
The ATmega8 was selected for study because the current IAR compiler could generate code using the hardware multiplier for this microcontroller. The IAR compiler could not do so for the other AVR devices like the ATmega64 or ATmega128.
Gathering benchmark results from both toolsets was straightforward. In IAR, the code size data is found in a map file (make sure it is generated under Project Options → Linker → List). Scroll down to the bottom of the map file and the following three lines appear:
184 bytes of CODE memory
80 bytes of DATA memory
66 bytes of CONST memory
As mentioned earlier, we count both CODE and CONST memory sections in the total code size, because compilers differ on where they place constant program data. For testing, the only legitimate way to compare code size is to include the constant size.
To find execution cycles in IAR, select the Simulator as the Debug tool and begin debugging. Launch the code profiler under View → Profiling. Click the Activate button and the Autorefresh button (see Figure 1). The debugger should automatically run to the first line of the C code. Press the Run key, and (if no breakpoints are set) the IAR debugger terminates at program exit. Look at the code profiler and report the number of cycles under Accumulated Time for main () — this is the number of cycles spent in the main routine and all subroutines called by main.
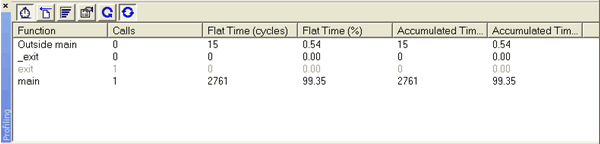
Figure 1. IAR Code Profiler: accumulated time (cycles) means the number of cycles spent in that routine and all subroutines which it calls.
Finding the generated code size in the Rowley toolset is also very easy. When the project builds, the Project Explorer lists the code size with the project. Figure 2 shows that for the MSP430F149, the 16-bit math benchmark code size is 238 bytes.
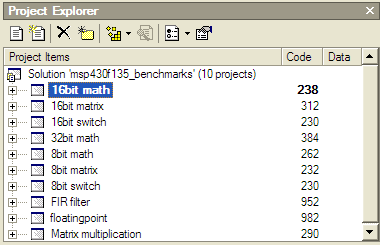
Figure 2. Rowley Project Explorer shows code size details for each project.
Determining the number of execution cycles in the Rowley tool is not quite as easy as with IAR—Rowley does not automatically stop at the end of the program nor does it separate where the cycles are spent. You must reset the cycle counter upon entry to the main program. To do this, first start debugging the program. When the compiler stops at the entry point to main, reset the cycle counter by double clicking on it.
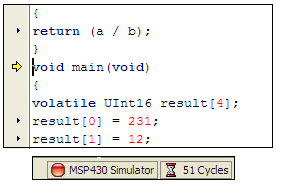
Figure 3. When the Rowley simulator stops at main (), reset the cycle counter (the picture with the hourglass) by double-clicking on it.
Next, set a breakpoint at the end of the application. (Note that lines with the blue triangles in the margins indicate where you can set breakpoints.) Run to the breakpoint and record the number of cycles reported.
There are other possible complications with using the Rowley simulator. Depending on the optimizations, you may only be able to simulate at the assembly level, in which case it is more difficult to find the end of the application. The best approach is to scan through the code and find the next RETURN statement in the assembly code, set your breakpoint there, and run to it. The simulator may not always stop at the main entry point. When this occurs, try pressing the Restart Debugging button. You may also need to manually find the main entry point and set a breakpoint there. Compiler SettingsWhen using the IAR toolset, the compiler options window in the project options is configured for the highest optimization level with all optimizations enabled (see Figure 4). To change between targeting smallest code and fastest execution, switch the selected radio button from Size to Speed.
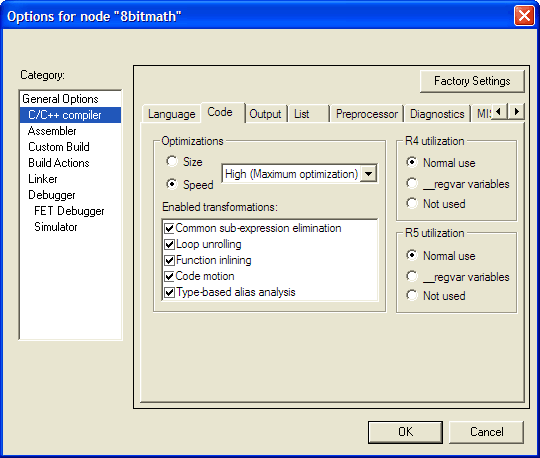
Figure 4. Options for the IAR compiler: all optimizations are enabled. The radio button switches the compiler between optimizing for speed and for size.
Rowley's CrossWorks allows users to create build configurations in addition to the default Debug and Release configurations. Therefore, the benchmark projects for this study also included the Fastest (see Figure 5) and Smallest (Figure 6) configuration options. The Fastest configuration removes any optimization that values ​​code size at the expense of an instruction cycle.
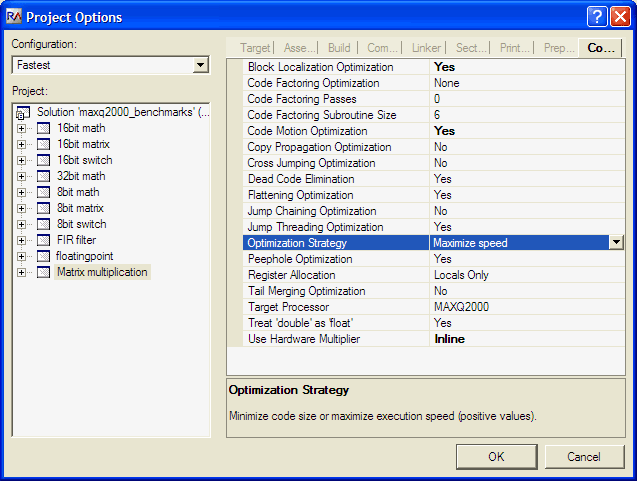
Figure 5. Project options used in Rowley's CrossWorks for the fastest configuration.
The settings for the smallest configuration appear in Figure 6. Options that favored code size at the expense of cycles were enabled, and the overall optimization strategy was to minimize size.
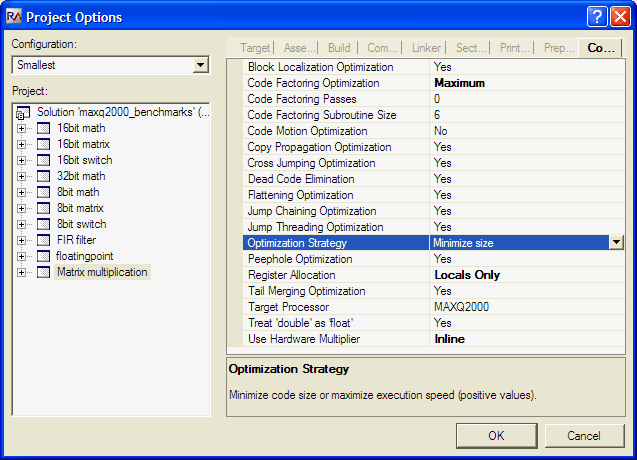
Figure 6. Project options used in Rowley's CrossWorks for the Smallest configuration.
The project and source files for each benchmark run by Maxim are available at #compiler_detail_links. The configurations in these project files are the same configurations used for the benchmarking. Links to trial versions of the IAR and Rowley tools are available with other third-party tools on the Maxim website, so you can easily reproduce these benchmark results.
MAXQ Benchmark ResultsTables 3 and 4 show the MAXQ benchmark results. Execution speed is again given as clock cycles and code size is given in bytes.
Table 3. Results from Maxim's Study: Execution Speed ​​(no. Of cycles)
Figure 7 graphs the data for execution speed. Only the fastest results are shown. Speed ​​is measured in execution cycles—a smaller bar means better performance.
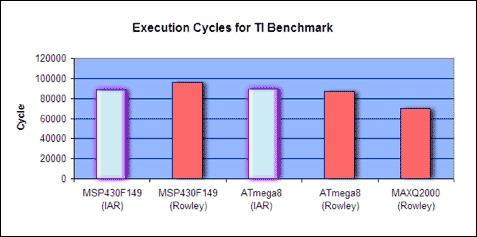
Figure 7. Execution speed results for the fastest configuration setting. The smaller MAXQ2000 bar shows better performance.
Table 4. Results from Maxim's Study: Code Size (no. Of bytes)
The following graph (Figure 8) shows the code size data for the smallest configuration results. Code size is measured in number of bytes—a smaller bar means better code density.
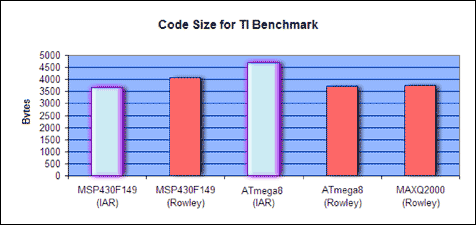
Figure 8. Code size results for the smallest configuration setting. The MAXQ2000's smaller bar indicates better code density.
Table 5. The Compiler Versions for This Study
Table 6. Issues Encountered When Running These Benchmarks
Analysis and SummaryAcross different compilers and with optimizations enabled, the above results show that the MSP430 is not the best performing microcontroller, even when running TI's specially crafted benchmark code.
When considering the total number of execution cycles required to run the entire benchmark suite, the MAXQ2000 outperforms the MSP430F149 and the ATmega8. The MAXQ2000 runs in 69,914 cycles, while the MSP430F149 (IAR) and ATmega8 (Rowley) take 89,253 and 87,000 cycles, respectively . When considering the total size for the benchmark code, the best-case results for the three microcontrollers vary by only 2%, making any difference in code size irrelevant.
Since code density is not a factor for this benchmark, we look deeper into the execution speed results. The total execution-cycle results are heavily weighted by the FIR filter results, where the MAXQ2000 clearly outperforms the competition. The MAXQ2000 is the best performer on the math benchmarks except for the ATmega8 in the 8-bit math benchmark. The MAXQ2000's weakest performance is on the 8-bit and 16-bit matrix benchmarks, which copy items from one multidimensional array to another.
To this point, we are only considering the performance of the test microcontrollers in terms of clock cycles. We have not considered the speed at which a device can run. For the sake of absolute comparison, we use benchmark iterations per second—the number of times that the entire TI benchmark suite can run in a second. Table 7 shows that when all devices run at the same clock speed, the MAXQ2000 is 28% faster than the MSP430F149 and 24% faster than the ATmega8. When the devices run at the maximum clock rate, the MAXQ2000 is 56% faster than the ATmega8 and 218% faster than the MSP430F149.
Table 7. Results from Maxim's Study: Speed ​​(Iterations per Second and at FMAX)
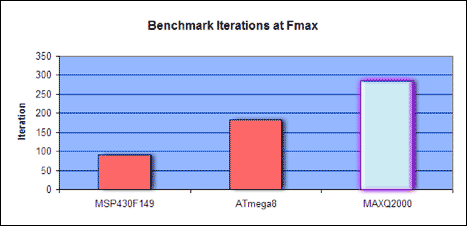
Figure 9. Benchmark iterations per second when running at the maximum clock rate. The taller MAXQ2000 bar shows better performance.
How should we summarize the results of the Maxim benchmark study? At the very least, it counters the results of the TI benchmark study, which showed the MAXQ microcontroller architecture as unremarkable. This updated study shows that the MAXQ2000 is a code-efficient, fast microcontroller that should be considered for any new designs and redesigns that will benefit from a higher performance microcontroller.
This study is part of an ongoing effort. Please visit the homepage for MAXQ benchmarking for additional and updated studies. An evaluation kit is available for the MAXQ2000 microcontroller. For information on the EV kit, links to demonstration code, software, and application information, go to Evaluate the MAXQ2000 Microcontroller with the MAXQ2000-KIT.
IntroducTIonThe MAXQ's unique transfer-triggered architecture makes it a top performer in the 16-bit microcontroller market. The MAXQ instrucTIon set features single-clock and instruction-cycle operations for jumps, calls, returns, loop control, and arithmetic operations. As a result the MAXQ enables applications to process more data in less time than other microcontrollers. Designers can thus add more functionality in their applications or reduce power consumption by completing required tasks quickly and spending more time in low-power stop modes.
To demonstrate the MAXQ's capabilities for this competitive analysis, we took benchmark code written to showcase the MSP430, ran it on the MAXQ, and monitored MAXQ performance. The competitor's code initially made the MAXQ function comparatively slow and inefficiently. Later when Rowley's highly optimized CrossWorks compiler for the MAXQ was released to the market, we reran the benchmark code. We found that Rowley's compiler used MAXQ architectural features more effectively, and that the MAXQ outperformed both the Texas Instruments (TI) MSP430 and the Atmel AVR. The MAXQ executed the same code in fewer clock cycles. In addition, this accelerated performance did not penalize the user with extra code size—the MAXQ's code size is within 2% of the competitors' code sizes.
This application note presents the details of our study of the MAXQ, Atmel AVR, and TI MSP430 architectures. This study is transparent—there are no tricks of compiler optimizations or specialized code made to force one microcontroller to perform better than another. Project files and source code are provided on the Maxim Web site so that the results can be duplicated. The results of this study (and other MAXQ performance studies) can be found at MAXQBenchmark.
Notes About MethodologyOf the two compilers in this study, the IAR Embedded Workbench and the Rowley CrossWorks, we used Rowley's compiler to generate the MAXQ's benchmark data because it made the best use of MAXQ capabilities. Both the IAR and Rowley compiler results were used for the MSP430 and the AVR microcontroller tests.
The data for execution time were gathered with the simulators that ship with IAR's Embedded Workbench and Rowley's CrossWorks toolsets. The execution cycles counted did not include startup time; the count started at the entry point into the main () function and ended with the main ( ) function's return statement.
Code sizes are in bytes and include both CONSTANT and CODE segments. This is because some tools include application constants in the CODE segment, which would make a device's code density appear incorrectly high. Combining the sizes of the CODE and CONSTANT segments ensure an equivalent comparison .
In general, we configured the compilers to use their highest code-optimization levels for ALL devices. This typically meant that all optimizations were enabled when targeting the smallest code size, and almost all optimizations were enabled when targeting the fastest code (because some compiler optimizations sacrifice speed for code size). In some instances, the high optimization settings caused problems—the code generated failed to simulate properly, never reaching the return statement. Often, the code began to work when the optimization level changed. We will indicate when such reductions of the optimization level were required. The project files that accompany this application note contain the optimization settings used to generate the benchmark data.
TI BenchmarkThis benchmark is a suite of tests published by Texas Instruments to showcase the MSP430. The suite contains 10 individual benchmarks: 8-bit math routines 8-bit matrix (array) accesses 8-bit switch statements 16-bit math routines 16-bit matrix (array) accesses 16-bit switch statement 32-bit math routines Floating point math routines Finite impulse response algorithm Matrix multiplication Following the TI test parameters, the MAXQ performed poorly. It generated code that was larger and slower than most of the other microcontrollers . Naturally, the TI study showed the MSP430 the winner in the comparisons. However, there were flaws in TI's methodology that demanded further analysis. Consequently, we examined how the MAXQ performed with the Rowley CrossWorks compiler.
The TI application note, including the source code, is available for download.
TI ResultsThe TI study provided results for execution speed (in clock cycles) and code density (in bytes), as shown in Table 1 and Table 2. Note that some of the device names (taken directly from the TI application note) are unclear. For instance, does 8051 refer to a 12-clock, 6-clock, 4-clock, or even 1-clock 8051 architecture?
Table 1. TI Study Results: Execution Speed ​​(no. Of cycles)
| Application | MSP430F135 | ATmega8 | PIC18F242 | 8051 | H8 / 300L | MC68HC11 | MAXQ20 | ARM7-TDMI (Thumb) |
| 8-bit math | 299 | 157 | 318 | 112 | 680 | 387 | 421 | 185 |
| 8-bit matrix | 2899 | 5300 | 20045 | 17744 | 9098 | 15412 | 31691 | 2227 |
| 8-bit switch | 50 | 131 | 109 | 84 | 388 | 214 | 58 | 146 |
| 16-bit math | 343 | 319 | 625 | 426 | 802 | 508 | 815 | 259 |
| 16-bit matrix | 5784 | 24426 | 27021 | 29468 | 15280 | 23164 | 60214 | 2998 |
| 16-bit switch | 49 | 144 | 163 | 120 | 398 | 230 | 51 | 146 |
| 32-bit math | 792 | 782 | 1818 | 2937 | 1756 | 1446 | 1034 | 115 |
| Floating point | 1207 | 1601 | 1599 | 2487 | 2458 | 4664 | 1943 | 108 |
| FIR filter | 152193 | 164793 | 248655 | 206806 | 245588 | 567139 | 464558 | 43191 |
| Matrix multiply | 6633 | 16027 | 36190 | 9454 | 26750 | 26874 | 66534 | 2918 |
| TOTALS | 170249 | 213680 | 336543 | 269638 | 303198 | 640038 | 627319 | 52293 |
Table 2. TI Study Results: Code Size (no. Of bytes)
| Application | MSP430F135 | ATmega8 | PIC18F242 | 8051 | H8 / 300L | MC68HC11 | MAXQ20 | ARM7-TDMI (Thumb) |
| 8-bit math | 172 | 116 | 386 | 141 | 354 | 285 | 352 | 660 |
| 8-bit matrix | 118 | 364 | 676 | 615 | 356 | 380 | 378 | 408 |
| 8-bit switch | 180 | 342 | 404 | 209 | 362 | 387 | 202 | 504 |
| 16-bit math | 172 | 174 | 598 | 361 | 564 | 315 | 286 | 676 |
| 16-bit matrix | 156 | 570 | 846 | 825 | 450 | 490 | 526 | 428 |
| 16-bit switch | 178 | 388 | 572 | 326 | 404 | 405 | 188 | 504 |
| 32-bit math | 250 | 316 | 960 | 723 | 876 | 962 | 338 | 620 |
| Floating point | 662 | 1042 | 1778 | 1420 | 1450 | 1429 | 1596 | 1556 |
| FIR filter | 668 | 1292 | 2146 | 1915 | 1588 | 1470 | 1828 | 1420 |
| Matrix multiply | 252 | 510 | 936 | 345 | 462 | 499 | 494 | 432 |
| TOTALS | 2808 | 5114 | 9302 | 6880 | 6866 | 6622 | 6188 | 7208 |
From this data, the MSP430 produced the densest code—45% smaller than the Atmel AVR microcontroller. The MSP430 also appeared to perform best, with the exception of the 32-bit ARM processor. These results also showed the MAXQ to be comparatively slow and inefficient.
Flaws with the TI Benchmark StudyThe manner in which TI produced its benchmarks raised some questions.
The first problem is that TI did not use any optimizations in their study. TI argued against compiler optimizations in order to remove the compiler from consideration and to make the microcontroller perform on its own. The problem with this argument is that engineers still use a compiler to generate machine code. If a compiler does not take advantage of the architectural features of a microcontroller when optimizations are not enabled, then you do not get a realistic idea of ​​the microcontroller's performance. In addition, benchmarks are only valuable if they model real applications . An engineer is likely to enable optimizations for size or speed in a real application, and these should thus be included as part of the benchmark study.
The second flaw in the TI benchmark study is that they only considered one compiler. Admittedly, the Rowley compiler was not available to TI at that time. Now available, the Rowley compiler dramatically updates the earlier TI results.
Maxim's ApproachAs explained above, our reevaluation of the TI benchmark focused on the MSP430, Atmel AVR, and MAXQ architectures. We considered execution and code size data for both the IAR Embedded Workbench and the Rowley CrossWorks toolsets. All results for execution speed were obtained through simulation.
The MAXQ device in this study was the MAXQ2000 microcontroller. In addition to an array of peripherals including an LCD controller, the MAXQ2000 has 16 16-bit accumulators and a 16 x 16 hardware multiply accelerator. For this study, we enabled the hardware multipliers on all three devices under test—we assumed that if performance on mathematical computations (such as a FIR filter) was important, a designer would choose a microcontroller with a multiply accelerator.
For the MSP430 device, we targeted the MSP430F149, a different device than TI targeted in their study (the MSP430F135). We chose the F149 because it has a hardware multiply unit, making comparison to the MAXQ2000 more equitable.
The ATmega8 was selected for study because the current IAR compiler could generate code using the hardware multiplier for this microcontroller. The IAR compiler could not do so for the other AVR devices like the ATmega64 or ATmega128.
Gathering benchmark results from both toolsets was straightforward. In IAR, the code size data is found in a map file (make sure it is generated under Project Options → Linker → List). Scroll down to the bottom of the map file and the following three lines appear:
184 bytes of CODE memory
80 bytes of DATA memory
66 bytes of CONST memory
As mentioned earlier, we count both CODE and CONST memory sections in the total code size, because compilers differ on where they place constant program data. For testing, the only legitimate way to compare code size is to include the constant size.
To find execution cycles in IAR, select the Simulator as the Debug tool and begin debugging. Launch the code profiler under View → Profiling. Click the Activate button and the Autorefresh button (see Figure 1). The debugger should automatically run to the first line of the C code. Press the Run key, and (if no breakpoints are set) the IAR debugger terminates at program exit. Look at the code profiler and report the number of cycles under Accumulated Time for main () — this is the number of cycles spent in the main routine and all subroutines called by main.
Figure 1. IAR Code Profiler: accumulated time (cycles) means the number of cycles spent in that routine and all subroutines which it calls.
Finding the generated code size in the Rowley toolset is also very easy. When the project builds, the Project Explorer lists the code size with the project. Figure 2 shows that for the MSP430F149, the 16-bit math benchmark code size is 238 bytes.
Figure 2. Rowley Project Explorer shows code size details for each project.
Determining the number of execution cycles in the Rowley tool is not quite as easy as with IAR—Rowley does not automatically stop at the end of the program nor does it separate where the cycles are spent. You must reset the cycle counter upon entry to the main program. To do this, first start debugging the program. When the compiler stops at the entry point to main, reset the cycle counter by double clicking on it.
Figure 3. When the Rowley simulator stops at main (), reset the cycle counter (the picture with the hourglass) by double-clicking on it.
Next, set a breakpoint at the end of the application. (Note that lines with the blue triangles in the margins indicate where you can set breakpoints.) Run to the breakpoint and record the number of cycles reported.
There are other possible complications with using the Rowley simulator. Depending on the optimizations, you may only be able to simulate at the assembly level, in which case it is more difficult to find the end of the application. The best approach is to scan through the code and find the next RETURN statement in the assembly code, set your breakpoint there, and run to it. The simulator may not always stop at the main entry point. When this occurs, try pressing the Restart Debugging button. You may also need to manually find the main entry point and set a breakpoint there. Compiler SettingsWhen using the IAR toolset, the compiler options window in the project options is configured for the highest optimization level with all optimizations enabled (see Figure 4). To change between targeting smallest code and fastest execution, switch the selected radio button from Size to Speed.
Figure 4. Options for the IAR compiler: all optimizations are enabled. The radio button switches the compiler between optimizing for speed and for size.
Rowley's CrossWorks allows users to create build configurations in addition to the default Debug and Release configurations. Therefore, the benchmark projects for this study also included the Fastest (see Figure 5) and Smallest (Figure 6) configuration options. The Fastest configuration removes any optimization that values ​​code size at the expense of an instruction cycle.
Figure 5. Project options used in Rowley's CrossWorks for the fastest configuration.
The settings for the smallest configuration appear in Figure 6. Options that favored code size at the expense of cycles were enabled, and the overall optimization strategy was to minimize size.
Figure 6. Project options used in Rowley's CrossWorks for the Smallest configuration.
The project and source files for each benchmark run by Maxim are available at #compiler_detail_links. The configurations in these project files are the same configurations used for the benchmarking. Links to trial versions of the IAR and Rowley tools are available with other third-party tools on the Maxim website, so you can easily reproduce these benchmark results.
MAXQ Benchmark ResultsTables 3 and 4 show the MAXQ benchmark results. Execution speed is again given as clock cycles and code size is given in bytes.
Table 3. Results from Maxim's Study: Execution Speed ​​(no. Of cycles)
| Application | MSP430F149 IAR | MSP430F149 Rowley | ATmega8 IAR | ATmega8 Rowley | MAXQ2000 Rowley | |||||
| Configuration | Small | Fast | Small | Fast | Small | Fast | Small | Fast | Small | Fast |
| 8-bit math | 243 | 243 | 276 | 272 | 110 | 110 | 279 | 278 | 278 | 245 |
| 8-bit matrix | 1629 | 963 | 6243 | 2659 | 1508 | 1074 | 7348 | 3763 | 3461 | 2947 |
| 8-bit switch | 31 | 31 | twenty four | twenty four | 84 | 36 | 45 | 45 | 39 | 39 |
| 16-bit math | 219 | 219 | 250 | 250 | 275 | 266 | 348 | 330 | 194 | 191 |
| 16-bit matrix | 1906 | 899 | 6755 | 3171 | 1147 | 697 | 5251 | 5250 | 3205 | 2691 |
| 16-bit switch | 30 | 30 | twenty four | twenty four | 111 | 44 | 50 | 50 | 39 | 39 |
| 32-bit math | 575 | 575 | 790 | 716 | 746 | 731 | 995 | 885 | 545 | 521 |
| Floating point | 784 | 784 | 1097 | 921 | 1614 | 1565 | 1491 | 919 | 763 | 744 |
| FIR filter | 86042 | 82748 | 90812 | 82592 | 82779 | 82779 | 73598 | 66249 | 62280 | 59470 |
| Matrix multiply | 4254 | 2761 | 6036 | 5436 | 7799 | 2396 | 11081 | 9231 | 3704 | 3027 |
| TOTALS | 95713 | 89253 | 112307 | 96065 | 96173 | 89698 | 100486 | 87000 | 74508 | 69914 |
Figure 7 graphs the data for execution speed. Only the fastest results are shown. Speed ​​is measured in execution cycles—a smaller bar means better performance.
Figure 7. Execution speed results for the fastest configuration setting. The smaller MAXQ2000 bar shows better performance.
Table 4. Results from Maxim's Study: Code Size (no. Of bytes)
| Application | MSP430F149 IAR | MSP430F149 Rowley | ATmega8 IAR | ATmega8 Rowley | MAXQ2000 Rowley | |||||
| Configuration | Small | Fast | Small | Fast | Small | Fast | Small | Fast | Small | Fast |
| 8-bit math | 192 | 192 | 258 | 262 | 98 | 98 | 212 | 212 | 248 | 284 |
| 8-bit matrix | 152 | 180 | 240 | 232 | 318 | 304 | 220 | 250 | 202 | 222 |
| 8-bit switch | 180 | 180 | 230 | 230 | 312 | 164 | 202 | 200 | 152 | 152 |
| 16-bit math | 140 | 140 | 220 | 220 | 162 | 154 | 222 | 238 | 162 | 164 |
| 16-bit matrix | 240 | 240 | 312 | 312 | 398 | 374 | 294 | 350 | 260 | 378 |
| 16-bit switch | 178 | 178 | 230 | 230 | 346 | 178 | 212 | 240 | 152 | 152 |
| 32-bit math | 236 | 236 | 284 | 388 | 306 | 296 | 380 | 460 | 274 | 324 |
| Floating point | 1100 | 1100 | 966 | 1004 | 1026 | 1046 | 816 | 936 | 1018 | 1090 |
| FIR filter | 1178 | 1174 | 924 | 966 | 1258 | 1258 | 860 | 896 | 1024 | 1044 |
| Matrix multiply | 266 | 250 | 312 | 316 | 476 | 324 | 294 | 348 | 254 | 264 |
| TOTALS | 3862 | 3870 | 4076 | 4160 | 4700 | 4196 | 3712 | 4130 | 3746 | 4074 |
The following graph (Figure 8) shows the code size data for the smallest configuration results. Code size is measured in number of bytes—a smaller bar means better code density.
Figure 8. Code size results for the smallest configuration setting. The MAXQ2000's smaller bar indicates better code density.
Table 5. The Compiler Versions for This Study
| Microcontroller | Compiler | Version |
| MAXQ2000 | Rowley | CrossWorks for MAXQ, Release 1.0, Build 2 |
| MSP430F149 | Rowley | CrossWorks for MSP430, Release 1.3, Build 3 |
| MSP430F149 | IAR | IAR C / C ++ Compiler for MSP430, V3.30A / W32 (3.30.1.1) |
| ATmega8 | Rowley | CrossWorks for AVR, Release 1.1, Build 1 |
| ATmega8 | IAR | IAR C / C ++ Compiler for AVR, 4.10B / W32 (4.10.2.3) |
Table 6. Issues Encountered When Running These Benchmarks
| Device | Tool | Configuration | Benchmark | Issue |
| ATmega8 | Rowley | Smallest | 16-bit matrix | The simulation would not terminate unless the Code Factoring optimization was set to NONE. |
| ATmega8 | IAR | Fastest | 8-bit matrix, 16-bit matrix | The simulation would not terminate unless the optimization level was set to medium instead of high. |
| ATmega8 | IAR | Smallest | FIR filter | Simulation would not terminate even at lowest optimization level. The numbers included in Table 3 and Table 4 are for the FIR filter in the fastest configuration. |
| ATmega8 | IAR | Both | Matrix multiplication | The simulation would not terminate on the ATmega8, ATmega16, or ATmega32 targets. The project was targeted instead for the ATmega64. |
Analysis and SummaryAcross different compilers and with optimizations enabled, the above results show that the MSP430 is not the best performing microcontroller, even when running TI's specially crafted benchmark code.
When considering the total number of execution cycles required to run the entire benchmark suite, the MAXQ2000 outperforms the MSP430F149 and the ATmega8. The MAXQ2000 runs in 69,914 cycles, while the MSP430F149 (IAR) and ATmega8 (Rowley) take 89,253 and 87,000 cycles, respectively . When considering the total size for the benchmark code, the best-case results for the three microcontrollers vary by only 2%, making any difference in code size irrelevant.
Since code density is not a factor for this benchmark, we look deeper into the execution speed results. The total execution-cycle results are heavily weighted by the FIR filter results, where the MAXQ2000 clearly outperforms the competition. The MAXQ2000 is the best performer on the math benchmarks except for the ATmega8 in the 8-bit math benchmark. The MAXQ2000's weakest performance is on the 8-bit and 16-bit matrix benchmarks, which copy items from one multidimensional array to another.
To this point, we are only considering the performance of the test microcontrollers in terms of clock cycles. We have not considered the speed at which a device can run. For the sake of absolute comparison, we use benchmark iterations per second—the number of times that the entire TI benchmark suite can run in a second. Table 7 shows that when all devices run at the same clock speed, the MAXQ2000 is 28% faster than the MSP430F149 and 24% faster than the ATmega8. When the devices run at the maximum clock rate, the MAXQ2000 is 56% faster than the ATmega8 and 218% faster than the MSP430F149.
Table 7. Results from Maxim's Study: Speed ​​(Iterations per Second and at FMAX)
| Device | Cycles | Fmax | Iterations / s at 1MHz | Iterations / s at Fmax |
| MSP430F149 | 89,253 | 8 | 11.20 | 89.60 |
| ATmega8 | 87,000 | 16 | 11.49 | 183.84 |
| MAXQ2000 | 69,914 | 20 | 14.30 | 286.00 |
Figure 9. Benchmark iterations per second when running at the maximum clock rate. The taller MAXQ2000 bar shows better performance.
How should we summarize the results of the Maxim benchmark study? At the very least, it counters the results of the TI benchmark study, which showed the MAXQ microcontroller architecture as unremarkable. This updated study shows that the MAXQ2000 is a code-efficient, fast microcontroller that should be considered for any new designs and redesigns that will benefit from a higher performance microcontroller.
This study is part of an ongoing effort. Please visit the homepage for MAXQ benchmarking for additional and updated studies. An evaluation kit is available for the MAXQ2000 microcontroller. For information on the EV kit, links to demonstration code, software, and application information, go to Evaluate the MAXQ2000 Microcontroller with the MAXQ2000-KIT.
Air Filter: Prevents harmful debris, dirt and contaminants from entering your engine.
Engine protection is the name of the game.So is engine performance. Acceleration can improve up to after an old, dirty air filter is replaced. Our Pennzoil air filters are engineered to trap harmful contaminants that can damage your engine.
Old and dirty air filters lead to reduced engine power, decreased throttle response, weaker acceleration and increased engine wear. Sounds ugly. Well, it is, and you should have it replaced when it gets bad.
Air Filter
Air Filter,Car Air Filter,Indoor Air Filter,Car Cabin Air Filter
Donguan Bronco Filter Co., Ltd , https://www.broncofilter-cn.com