Technical indicators are an objective basis for characterizing the performance of a product. Understanding technical indicators helps to properly select and use the product.
The technical indicators of the sensor are divided into two categories: static indicators and dynamic indicators. The static index mainly evaluates the performance of the sensor under static and invariant conditions, including resolution, repeatability, sensitivity, linearity, backlash error, threshold, creep, and stability.
Dynamic indicators mainly focus on the performance of sensors measured under rapidly changing conditions, including frequency response and step response.
Due to the large number of technical indicators of the sensor and the different angles of various literatures, different people have different understandings and even misunderstandings and ambiguities. To this end, the following are the main technical indicators for the sensor:
1, resolution and resolution:Definition: ResoluTIon refers to the minimum amount of change that a sensor can detect. Resolution (ResoluTIon) is the ratio of resolution to full scale value.
Interpretation 1: Resolution is the most basic indicator of a sensor, which characterizes the resolving power of the sensor pair. Other technical indicators of the sensor are described in terms of resolution as the smallest unit.
For sensors with digital display and instrumentation, the resolution determines the minimum number of bits displayed by the measurement. For example, the resolution of an electronic digital caliper is 0.01 mm, and the indication error is ±0.02 mm.
Interpretation 2: Resolution is an absolute value with units. For example, the resolution of a temperature sensor is 0.1 ° C, and the resolution of an acceleration sensor is 0.1 g.
Interpretation 3: Resolution is a resolution-related and very similar concept that characterizes the sensor's ability to resolve.
The main difference between the two is that the resolution is the resolution of the sensor in percent. It is a relative number and has no dimension. For example, if the temperature sensor has a resolution of 0.1 ° C and a full scale of 500 ° C, the resolution is 0.1 / 500 = 0.02%.
2, repeatability:Definition: The repeatability of a sensor is the degree of difference between measurement results under the same conditions for the same measurement and repeated measurements in the same direction. Also referred to as repetition error, reproduction error, and the like.
Interpretation 1: The repeatability of the sensor must be the degree of difference between multiple measurements obtained under the same conditions. If the measurement conditions change, the comparability between the measurement results disappears and cannot be used as a basis for assessing repeatability.
Interpretation 2: Sensor repeatability characterizes the dispersion and randomness of sensor measurements. The reason for this dispersion and randomness is that there are inevitably various random disturbances inside and outside the sensor, resulting in the final measurement result of the sensor appearing as a random variable.
Interpretation 3: Repetitive quantitative representation methods, the standard deviation of random variables can be used.
Interpretation 4: For the case of multiple repeated measurements, if the average of all the measured results is taken as the final measurement result, higher measurement accuracy can be obtained. Because the standard deviation of the mean is significantly less than the standard deviation of each measurement.
3, linearity:Definition: Linearity is the degree to which the sensor's input-output curve deviates from the ideal line.
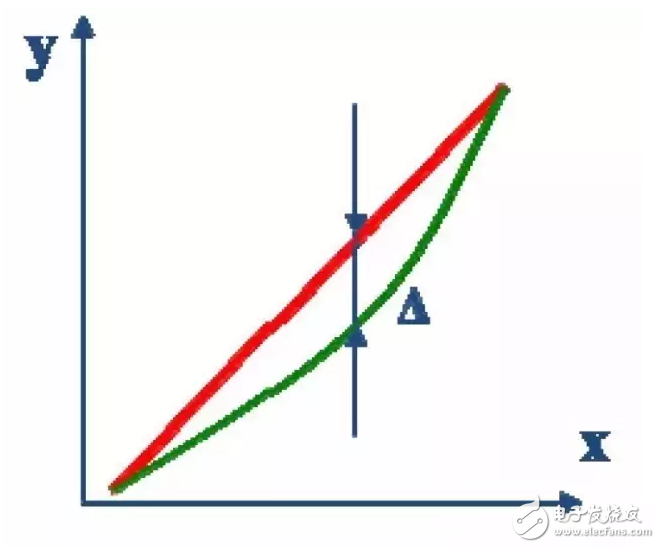
Interpretation 1: The ideal sensor input and output relationship should be linear, and its input and output curve should be a straight line (the red line in the figure below).
However, the actual sensor has more or less various errors, resulting in the actual input and output curve is not an ideal straight line, but a curve (green curve in the figure below).
Linearity is the degree of difference between the actual characteristic curve of the sensor and the offline line, also known as nonlinearity or nonlinearity.
Interpretation 2: Since the difference between the actual characteristic curve of the sensor and the ideal straight line is different under different measured conditions, the ratio of the maximum value of the difference between the two to the full scale range is often used. Obviously, linearity is also a relative amount.
Interpretation 3: Since the ideal straight line of the sensor is unknown for general measurement occasions, it is not available. To this end, a compromise is often used, that is, the measurement result of the sensor is directly used to calculate a fitted straight line that is closer to the ideal straight line. The specific calculation methods include the endpoint connection method, the best straight line method, and the least square method.
4, stability:Definition: Stability is the ability of a sensor to maintain its performance over time.
Interpretation 1: Stability is the main indicator to see if the sensor works stably in a certain time range. The factors that cause sensor instability include temperature drift and internal stress release. Therefore, measures such as increasing temperature compensation and increasing aging treatment are helpful for improving stability.
Interpretation 2: According to the length of time period, stability can be divided into short-term stability and long-term stability. When the inspection time is too short, the stability is close to the repeatability. Therefore, stability indicators mainly focus on long-term stability. The length of the specific time is determined by the environment and requirements.
Interpretation 3: The quantitative representation of the stability index can be either absolute or relative. For example, the stability of a strain gauge force sensor is 0.02%/12h.
5, sampling frequency:Definition: Sample Rate is the number of measurements that the sensor can sample in a unit of time.
Interpretation 1: The sampling frequency reflects the rapid response capability of the sensor and is the most important one of the dynamic characteristics. For situations where the measurement is rapidly changing, the sampling frequency is one of the technical indicators that must be fully considered. According to Shannon's sampling law, the sampling frequency of the sensor should be no less than twice the frequency of the measured change.
Interpretation 2: As the frequency of use is different, the accuracy index of the sensor also changes accordingly. In general, the higher the sampling frequency, the lower the measurement accuracy.
The highest accuracy given by the sensor is often the result obtained at the lowest sampling speed or even under static conditions. Therefore, both the accuracy and speed must be considered in the selection of the sensor.
Wireless Charger Car Phone Holder
Wireless Charger Car Phone Holder,In Car Phone Holder Wireless Charger,Car Phone Holder And Charger,Phone Car Mount With Wireless Charger
Ningbo Luke Automotive Supplies Ltd. , https://www.nbluke.com